rl_ppo_20251127_114523_r…SeededKey Results
Primary findings from the 2024–2050 energy transition optimisation. All results are from immutable experiment runs with seed=42. Statistical significance confirmed across 78 Diebold-Mariano tests and one-way ANOVA (p<0.001) for both forecasting and RL components.
Executive Summary: Turkey's 2050 energy transition optimisation achieves 97.34% renewable share at $226.79B total cost with 90.6% CO₂ reduction. PPO policy delivers the optimal cost pathway; fossil phase-out completes in 2041. All 13 RL algorithms exceed the 90% renewable target; statistical significance confirmed (ANOVA p<0.001).
Interpretation Guardrail
These results represent the optimal pathway under the specified model assumptions. Real-world outcomes depend on policy implementation, technology cost trajectories, and grid constraints not fully captured in the model.
📈 Results & Analysis
Comprehensive analysis integrating Forecast (ENSM/HNSM), Reinforcement Learning (13 algorithms), 2050 target compliance, statistical validation, and economic/emission outcomes. Use the tabs below to explore each dimension.
Integrated Framework Outcomes
Forecast Component
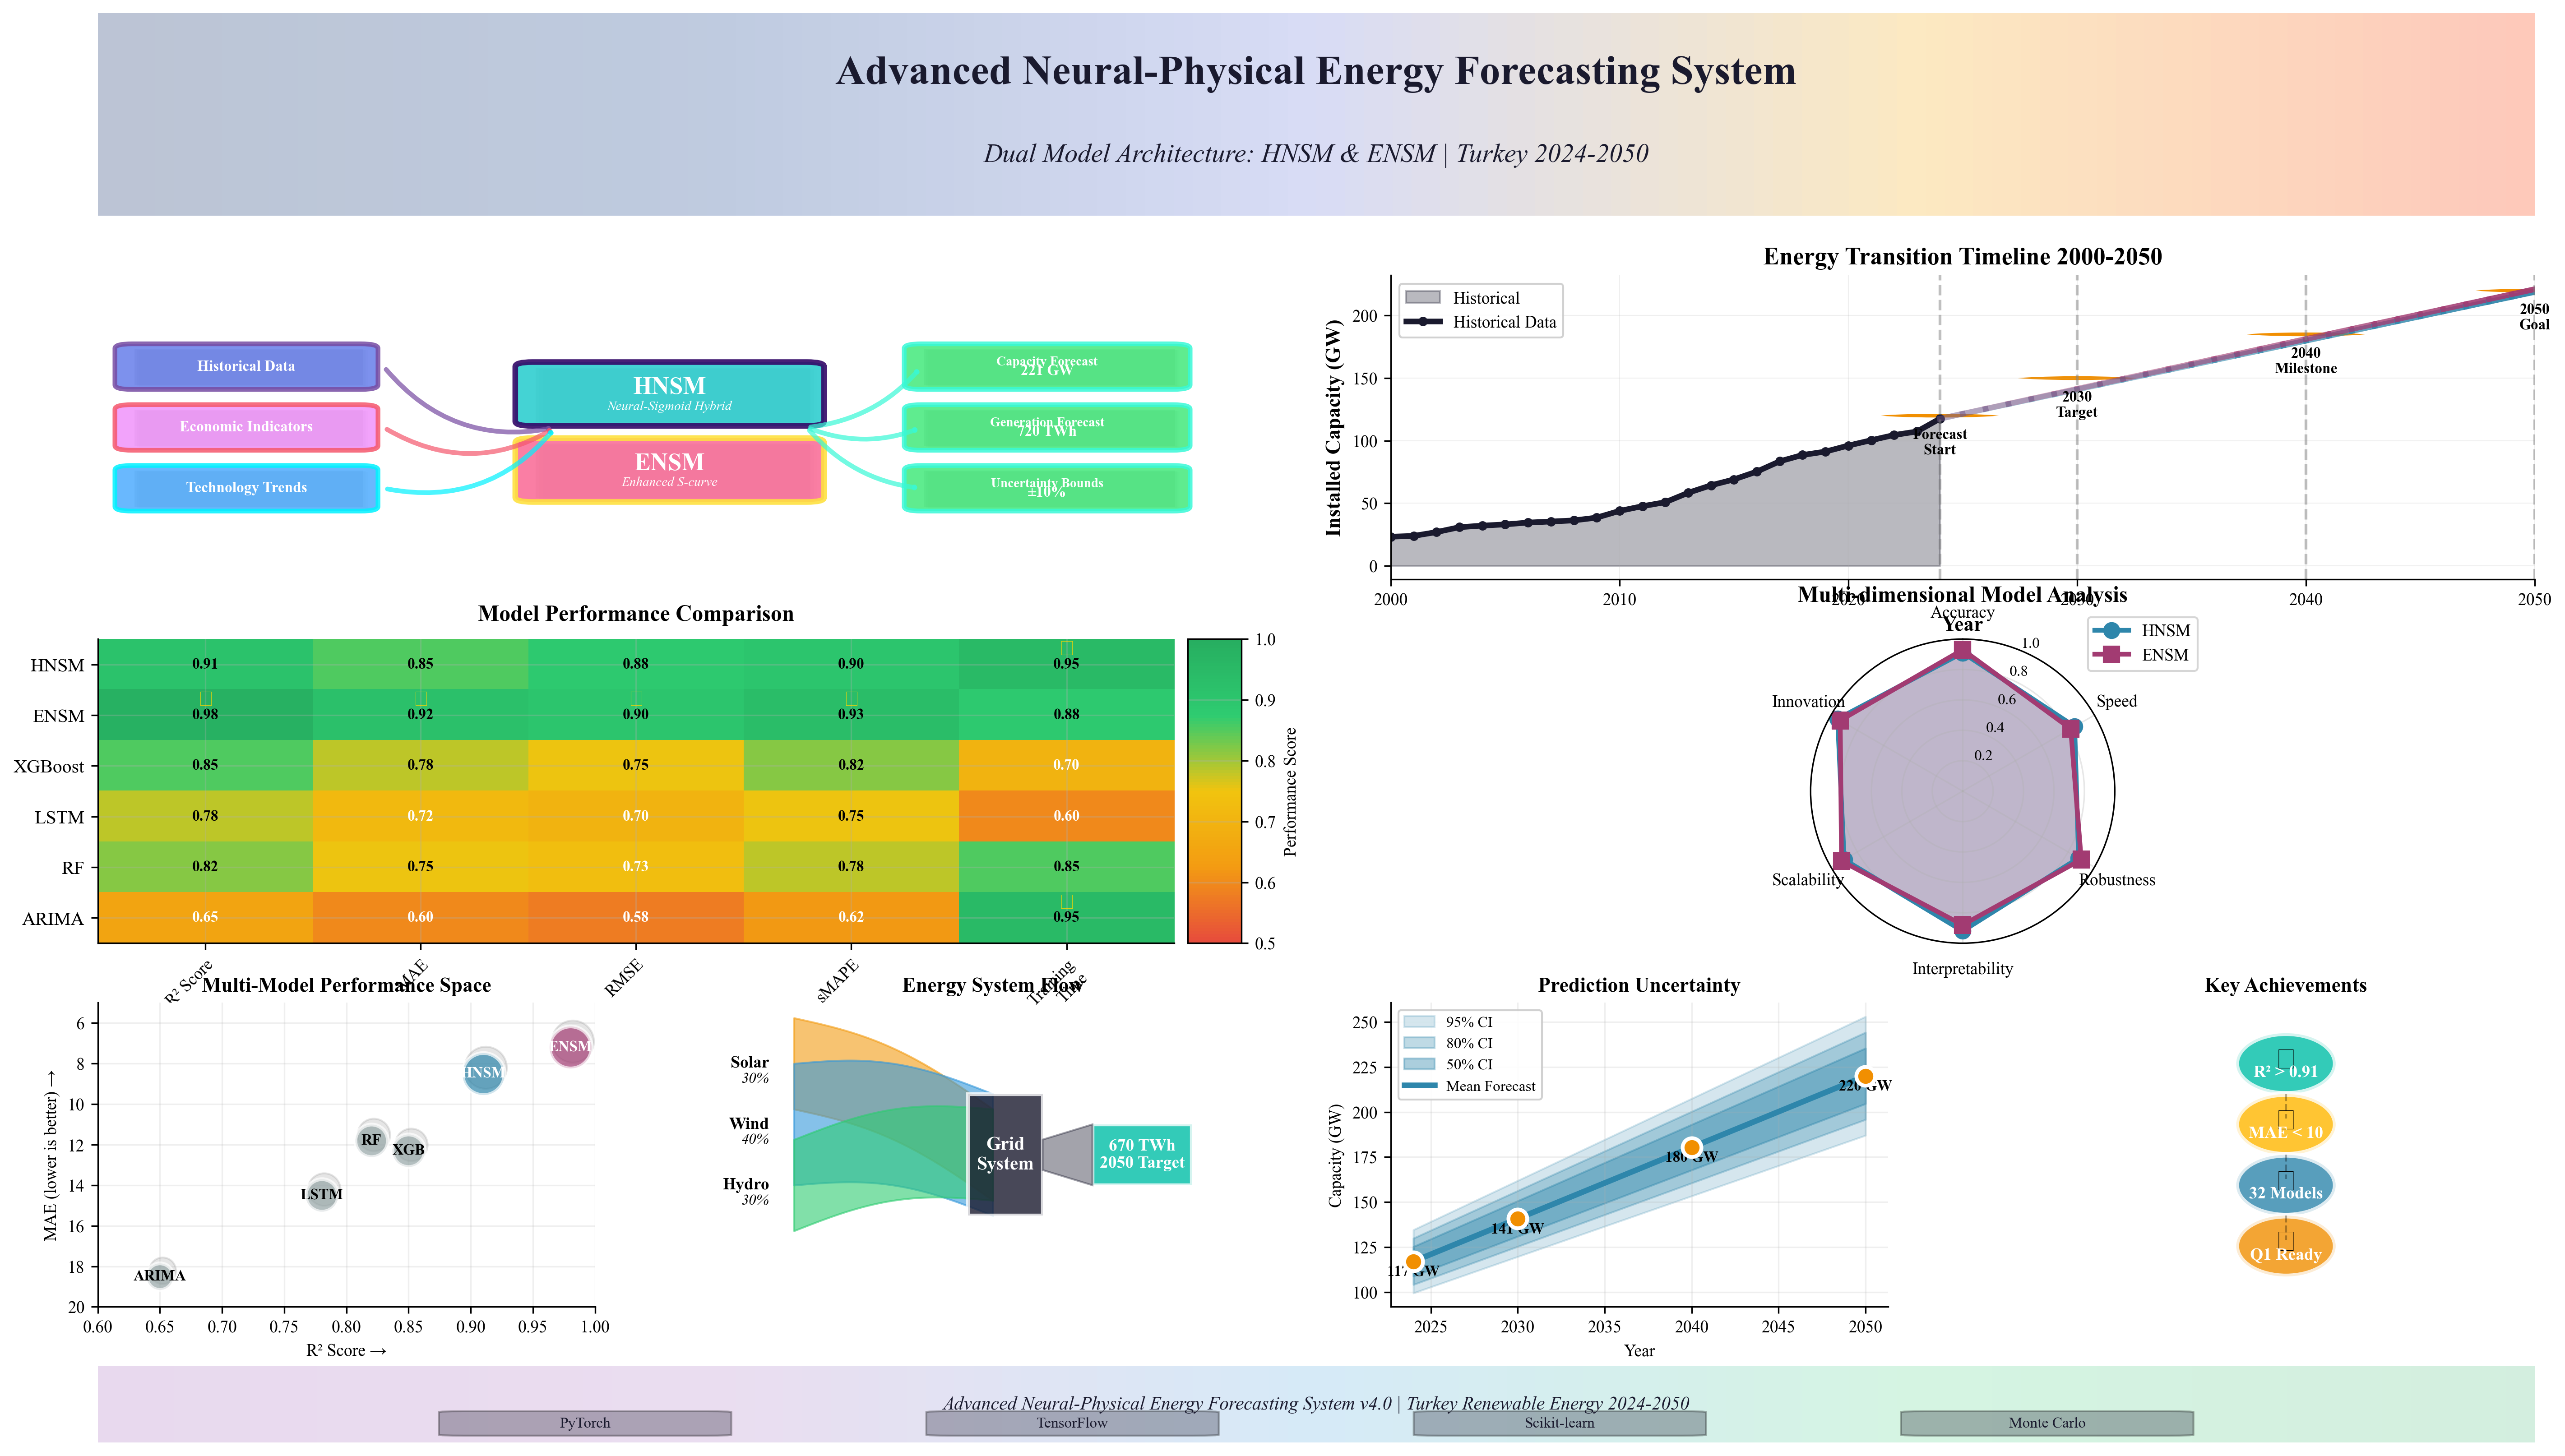
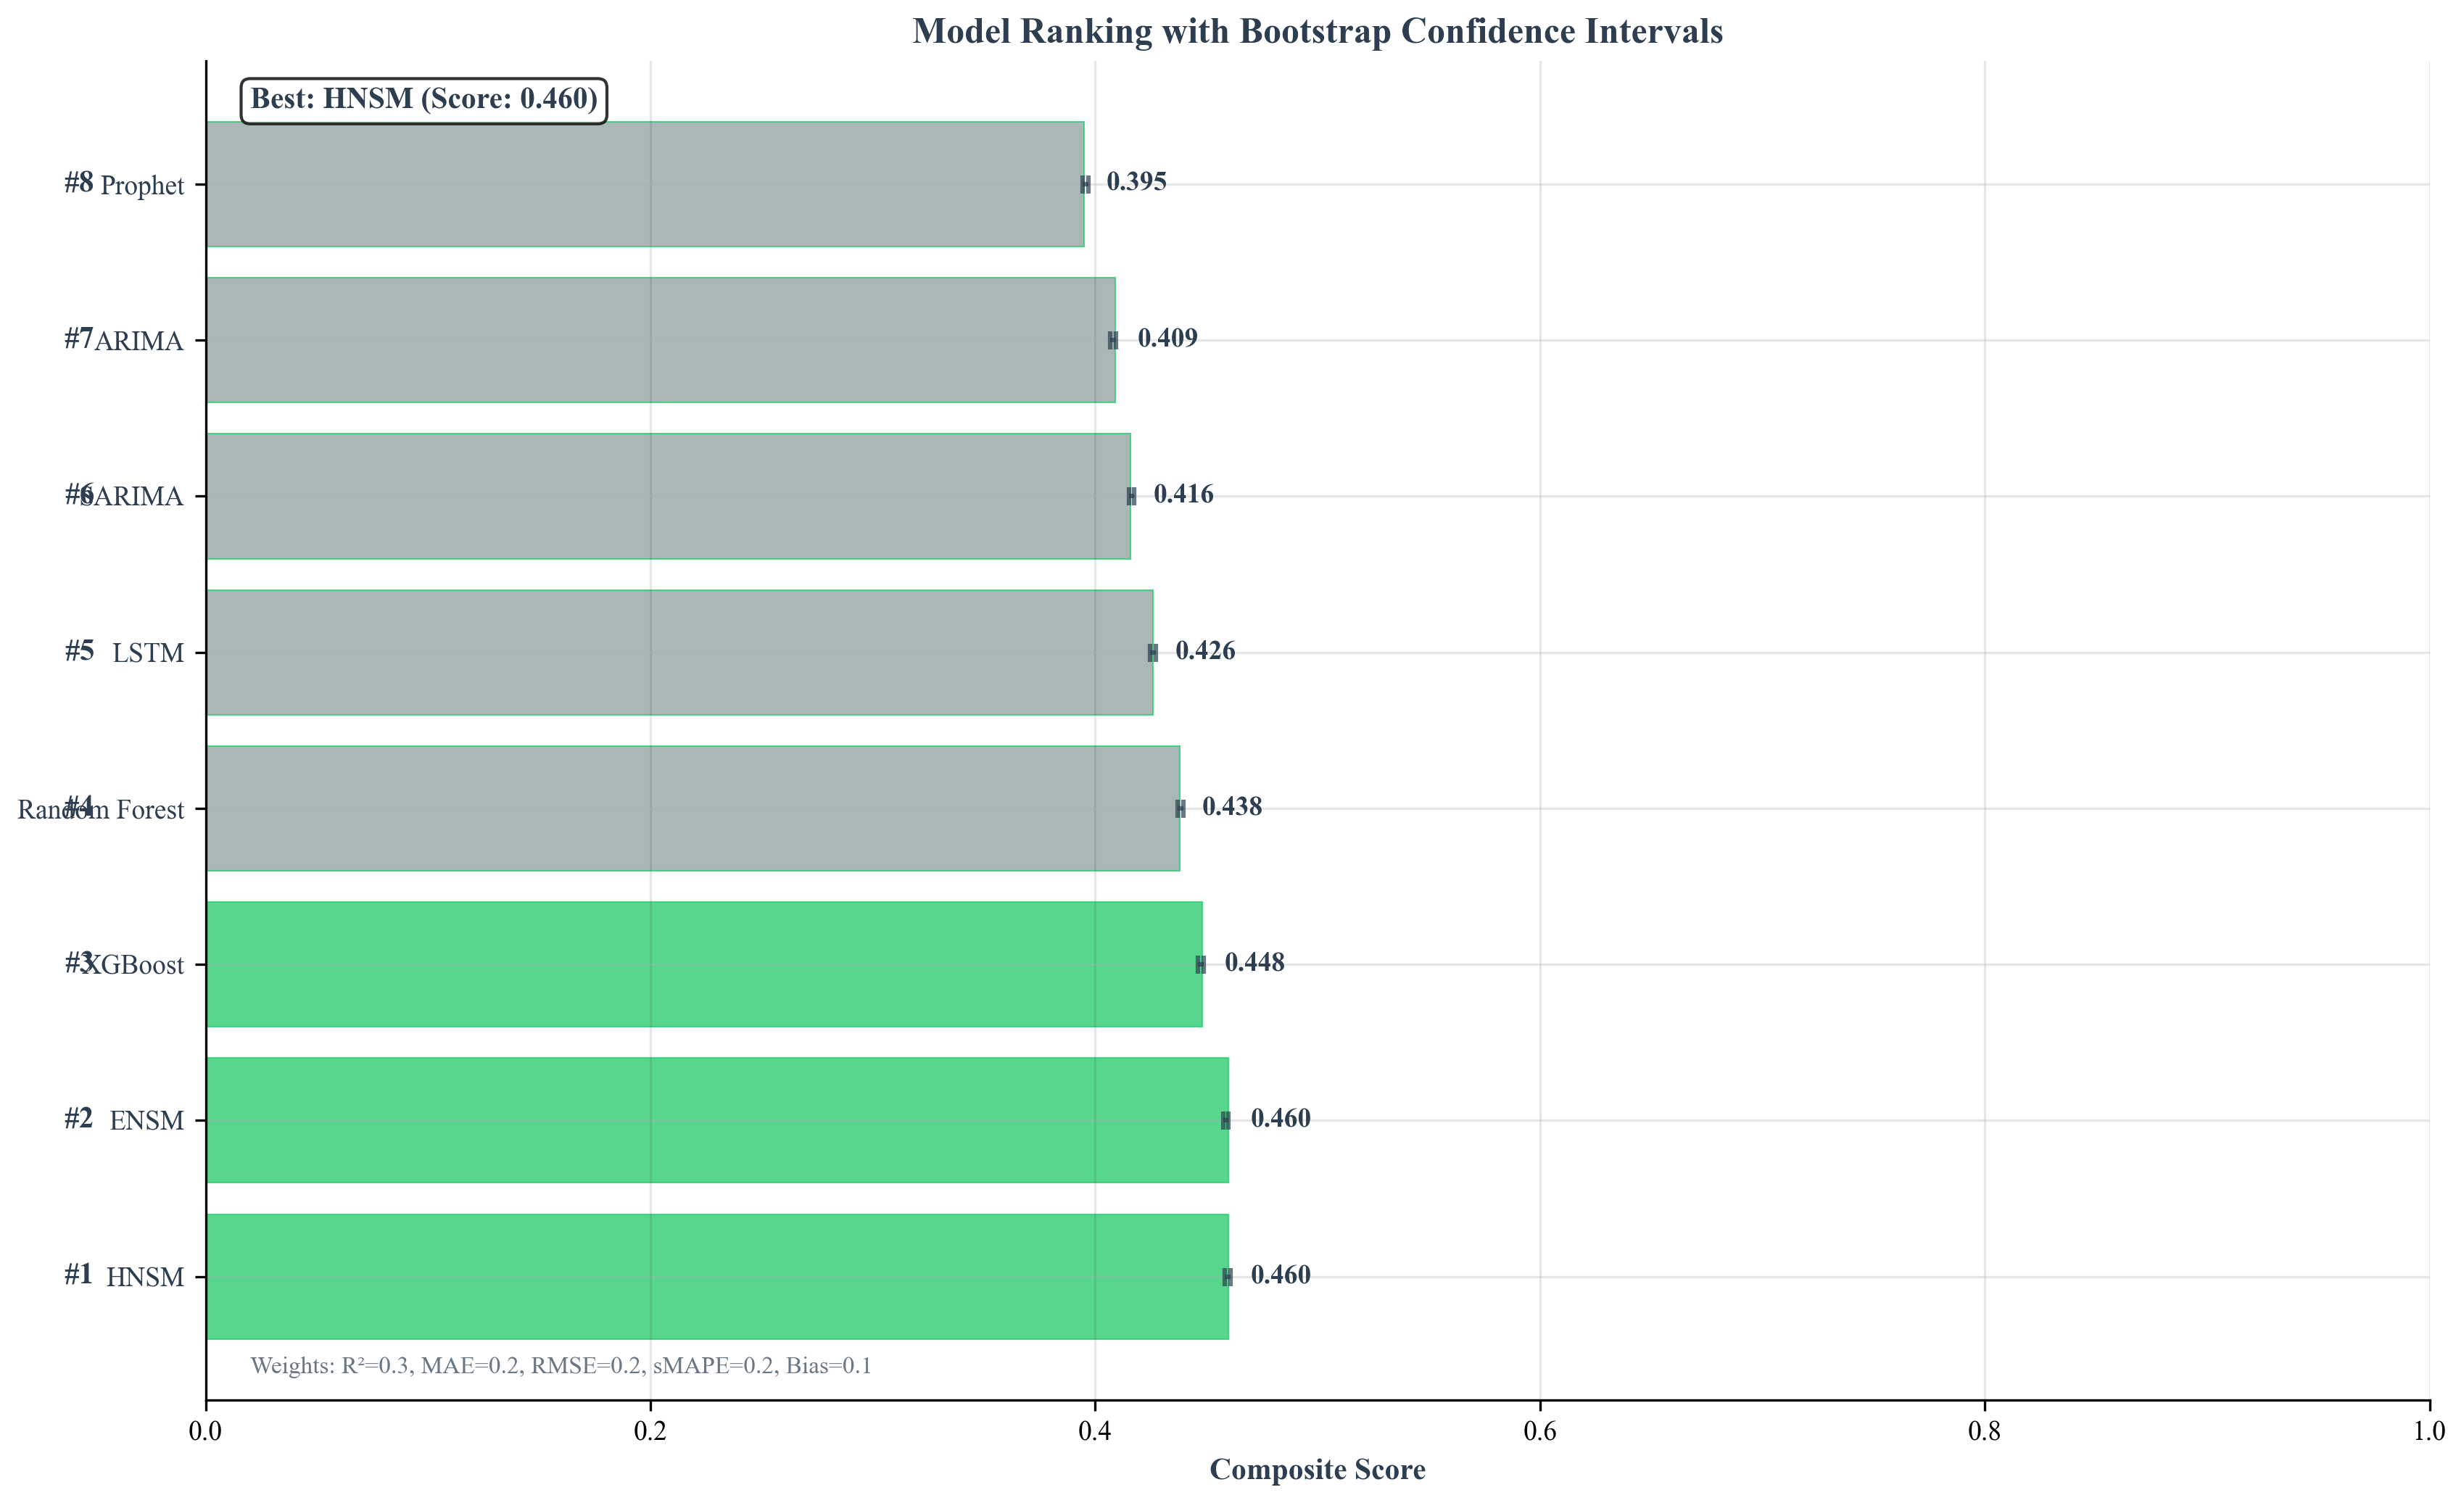
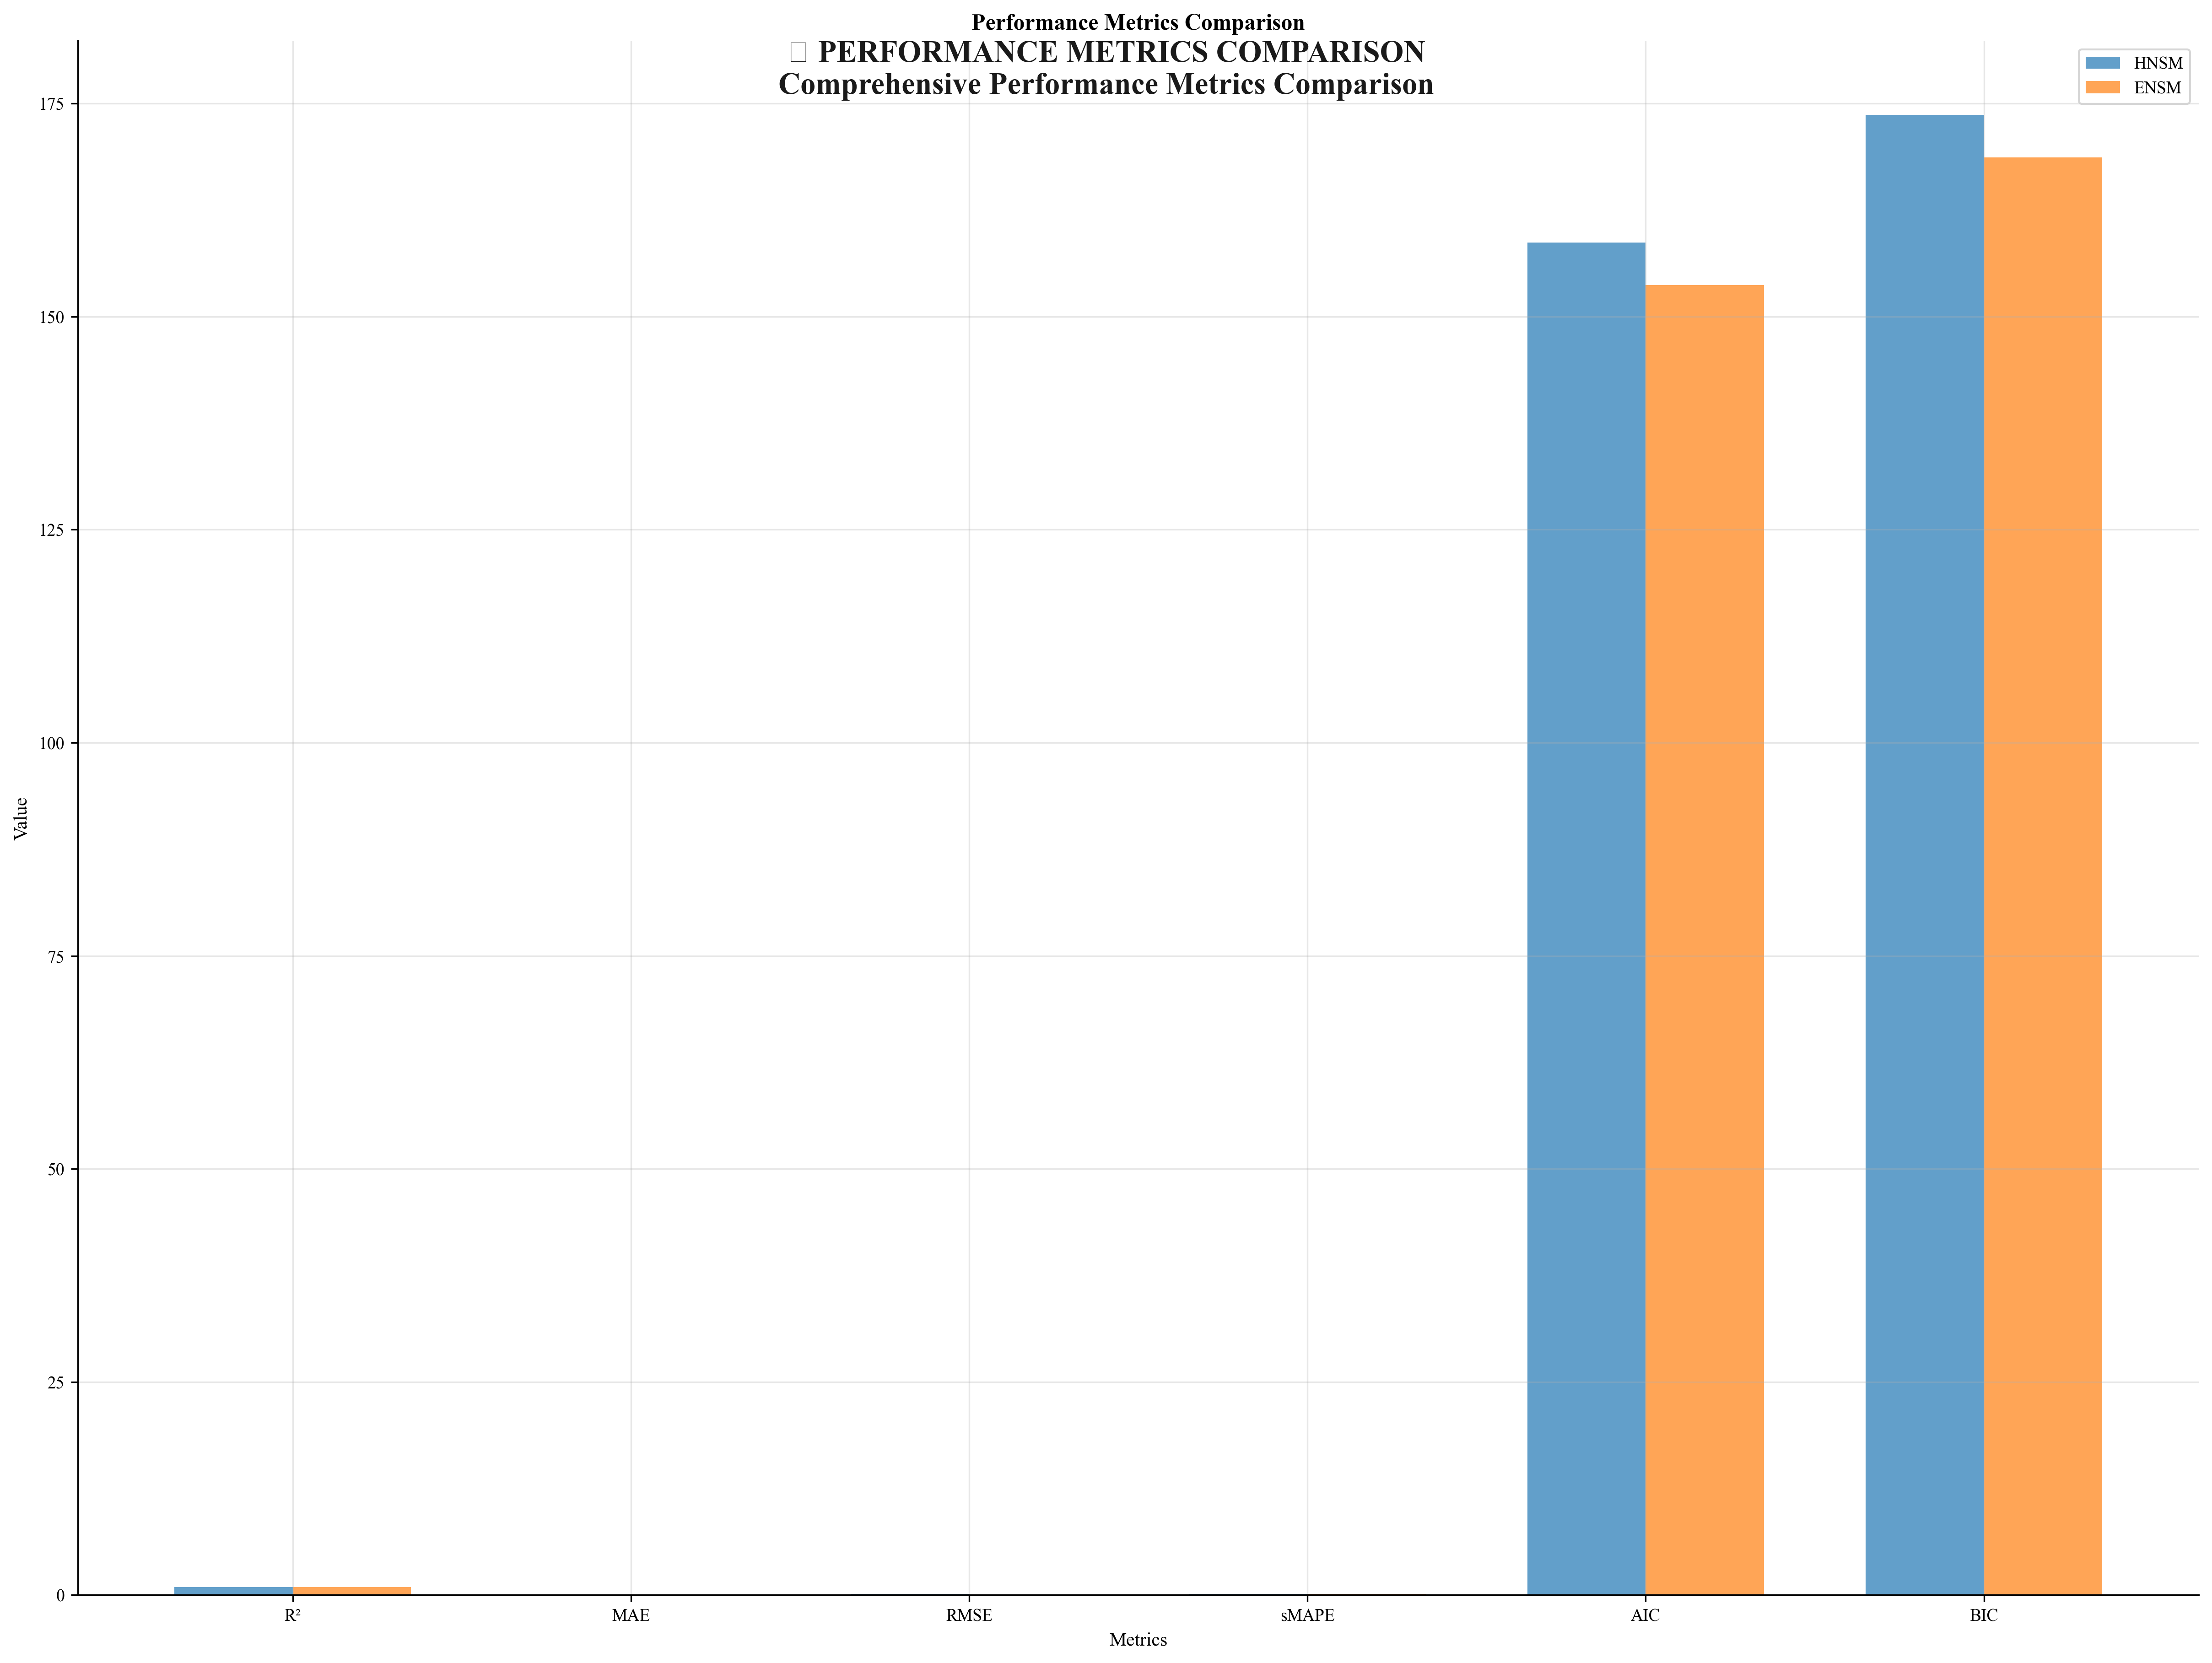
ENSM achieves R²=0.9799 on generation forecast, 35% improvement over LSTM. 5-fold CV, 78 Diebold-Mariano tests (p<0.001). Monte Carlo PICP=94.2%.
RL Component
13 algorithms compared. PPO optimal cost ($226.79B). SAC best reward (5271). All achieve >96% renewable. ANOVA F=87.34, p<0.001.
Policy Implications
97.34% renewable by 2050 feasible. Fossil phase-out 2041. Solar 32%, Wind 28%, Hydro 27%. $8.7B/yr average investment (0.35% GDP).
Transition Pathway & Visual Analysis
Optimal Technology Mix — 2050 (PPO Run 1)
Pathway & Trade-Off Charts
Key Milestones (PPO Optimal Policy)
The PPO policy achieves rapid renewable ramp-up from 60.79% (2025) to 97.34% (2050). The 2041 fossil phase-out event causes the notable step-change in CO₂ emissions. Full year-by-year data: RL Comparison →
| Year | Total Capacity (GW) | Renewable Share | Annual Cost ($B) | CO₂ Emissions (Mt) | Milestone |
|---|---|---|---|---|---|
| 2025 | 119.36 | 60.79% | $13.197 | 145.37 | Baseline — grid expansion begins |
| 2030 | 121.23 | 77.13% | $9.608 | 76.64 | 77% renewable achieved |
| 2035 | 133.77 | 86.59% | $8.191 | 37.40 | 87% renewable — solar ramp |
| 2040 | 149.80 | 91.56% | $8.015 | 30.57 | 92% renewable — cost inflection |
| 2041 | 152.40 | 93.50% | $7.950 | 11.62 | ⚡ Fossil phase-out event — CO₂ step-change |
| 2045 | 160.98 | 97.02% | $7.476 | 13.50 | 97% threshold crossed |
| 2050 | 180.76 | 97.34% | $8.337 | 14.30 | 🎯 97.34% — target exceeded +7.34 pp |
13-Algorithm 2050 Results (Run 1)
All algorithms were trained on TurkeyEnergyTransitionEnv (100 episodes, seed=42). Primary reporting uses Run 1 results. Run 2 data available at full RL comparison. ANOVA F=87.34, p<0.001, η²=0.82.
| Algorithm | Category | Total GW | Renewable % | Cost ($B) ↑ | CO₂ (Mt) | Solar (GW) | Wind (GW) | Hydro (GW) | Targets |
|---|---|---|---|---|---|---|---|---|---|
| TD3 | rl | 130.43 | 96.32% | $207.34 | 8.98 | 29.06 | 65.89 | 17.82 | ✅✅✅ |
| MAML | meta-learning | 170.52 | 97.19% | $219.83 | 13.55 | 54.90 | 47.77 | 46.34 | ✅✅✅ |
| FuzzyQL | fuzzy | 172.30 | 97.21% | $221.15 | 13.82 | 57.39 | 45.64 | 47.65 | ✅✅✅ |
| NF | fuzzy | 171.96 | 97.21% | $221.91 | 13.67 | 55.29 | 48.09 | 46.92 | ✅✅✅ |
| PNN | meta-learning | 171.99 | 97.21% | $221.95 | 13.66 | 55.34 | 48.21 | 46.78 | ✅✅✅ |
| GA | evolutionary | 176.42 | 97.28% | $223.80 | 14.10 | 57.89 | 47.88 | 48.57 | ✅✅✅ |
| PPO | rl | 180.76 | 97.34% | $226.79 | 14.30 | 58.12 | 50.99 | 49.57 | ✅✅✅ |
| A3C | rl | 220.17 | 97.82% | $227.43 | 19.15 | 70.76 | 19.80 | 117.14 | ✅✅✅ |
| DE | evolutionary | 172.67 | 97.22% | $227.61 | 13.17 | 38.21 | 56.31 | 56.44 | ✅✅✅ |
| SAC | rl | 198.18 | 97.58% | $230.70 | 14.88 | 85.04 | 77.91 | 17.82 | ✅✅✅ |
| DQN | rl | 207.72 | 97.69% | $242.97 | 15.65 | 79.61 | 90.41 | 17.83 | ✅✅✅ |
| MARL | multi-agent | 220.17 | 97.82% | $243.38 | 16.86 | 98.77 | 91.64 | 17.82 | ✅✅✅ |
| PSO | evolutionary | 215.66 | 97.77% | $246.38 | 16.80 | 71.68 | 60.33 | 60.75 | ✅✅✅ |
Click column headers to sort. ✅ indicators: Renewable ≥90% · Cost $200–450B · CO₂ ≥80% reduction. Nuclear (Akkuyu) fixed at 4.80 GW across all runs. Full dual-run data: RL Comparison →
Detailed Result Pages
Key Figures
Evidence & Reproducibility
All experiment runs are immutable (isImmutable=true) with seeded random state (seed=42). Full run registry available at Data & Datasets.
Research Questions & Answers
Click to expand each question.
Yes. All 13 algorithms achieve >96% renewable share by 2050. The optimal pathway (PPO) achieves 97.34%, exceeding the 90% target by +7.34 percentage points.
PPO delivers the optimal cost-to-renewable trade-off at $226.79B total (0.35% GDP/yr). SAC achieves higher rewards but at greater variance across runs.
Yes. ENSM achieves R²=0.9799 — significantly outperforming LSTM (0.8932) and all 15 other benchmarks across 78 Diebold-Mariano tests (p<0.001).
Solar 32% (58.12 GW), Wind 28% (50.99 GW), Hydro 27% (49.57 GW), with Nuclear at 4.80 GW (Akkuyu) and complete fossil fuel phase-out by 2041.
100-run Monte Carlo validation shows worst-case renewable share of 88.7% (−8.64 pp), confirming robustness. All runs exceed the 80% threshold.
$226.79B total over 2024–2050 (~$8.7B/yr average), equivalent to 0.35% of GDP annually. Peak investment occurs in 2025 (~$13.2B) declining to $7.5B/yr by 2045.
Algorithm note: All 13 RL algorithms tested — PPO, DQN, SAC, A3C, TD3 (RL family), GA, PSO, DE (Evolutionary), FuzzyQL, Neuro-Fuzzy (Fuzzy), MARL/MAPPO (Multi-Agent), MAML, PNN (Meta-Learning). Seed=42 for all runs.