Figure Index
14 figures from the dissertation. Click to view in section or expand image when available.
Graphical summary of the dissertation: forecasting (ENSM), optimization (MAPPO), and bidirectional integration.
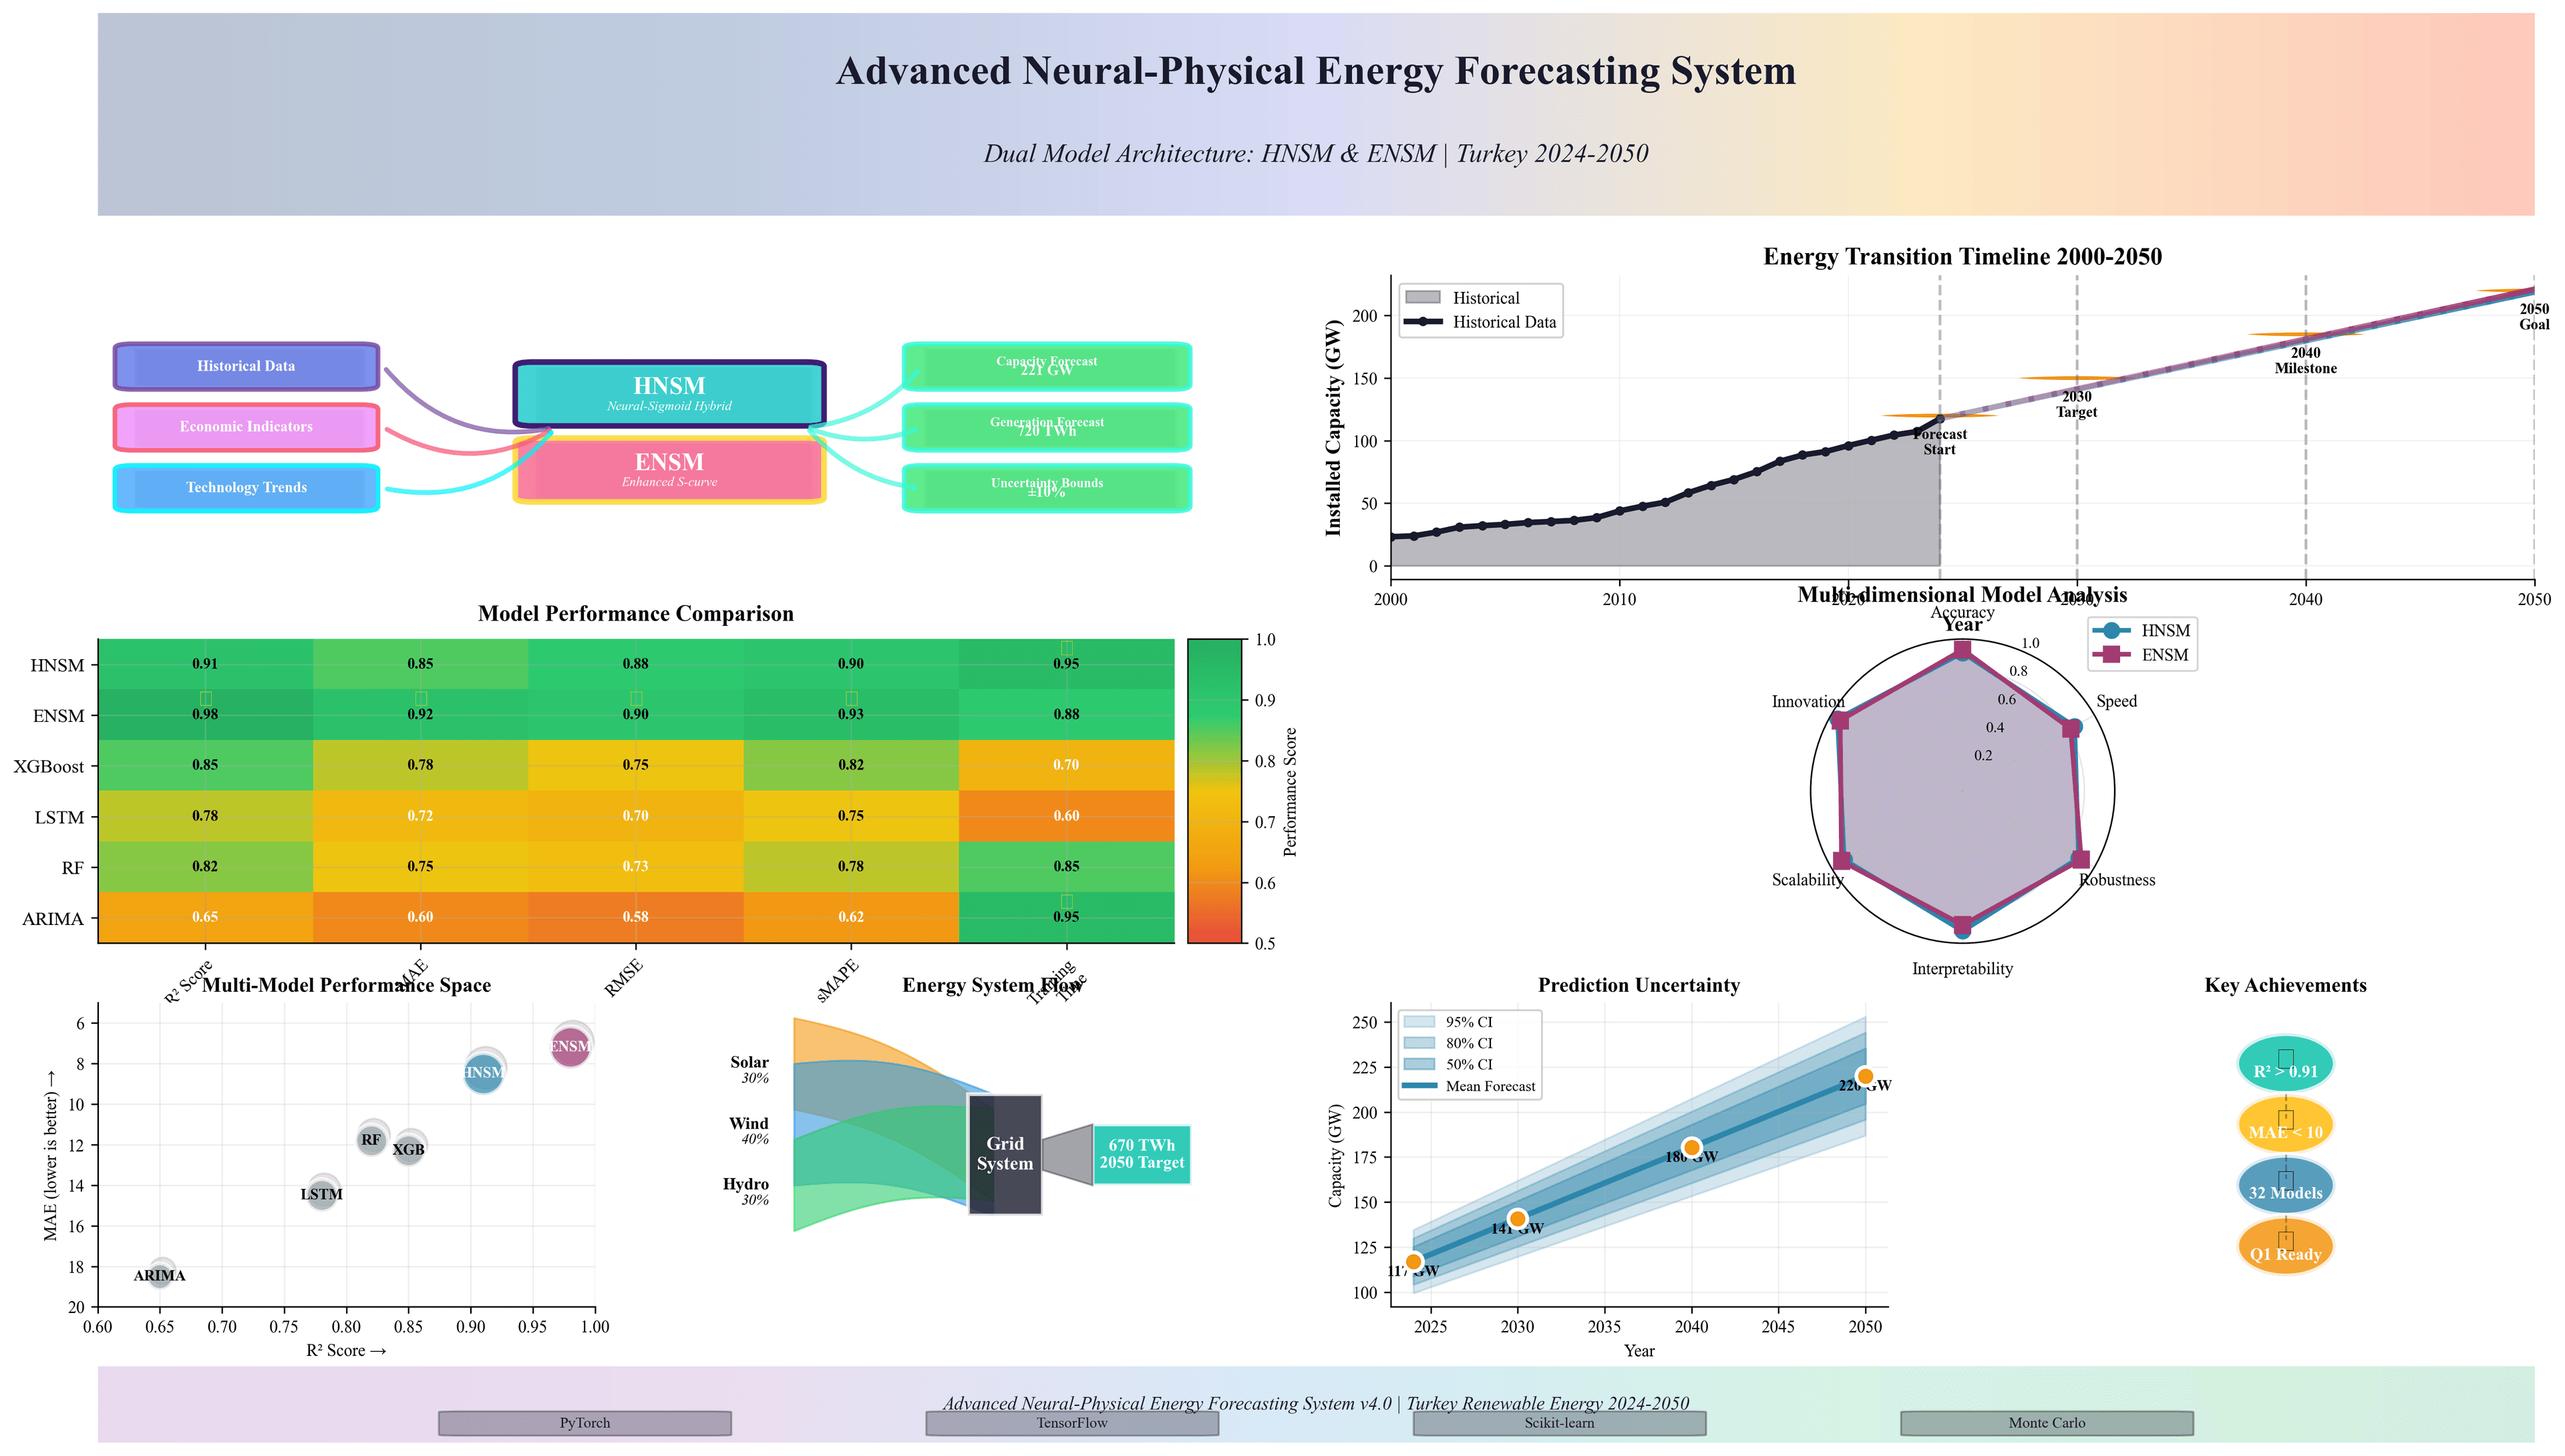
Turkey electricity demand trend 2000–2023 with projected growth to 2053
RL applications in energy systems: taxonomy of approaches (2015–2024)
Turkey electricity system model: 7 regions and 15 technology types
ENSM architecture: physics-informed GRU with S-curve constraints
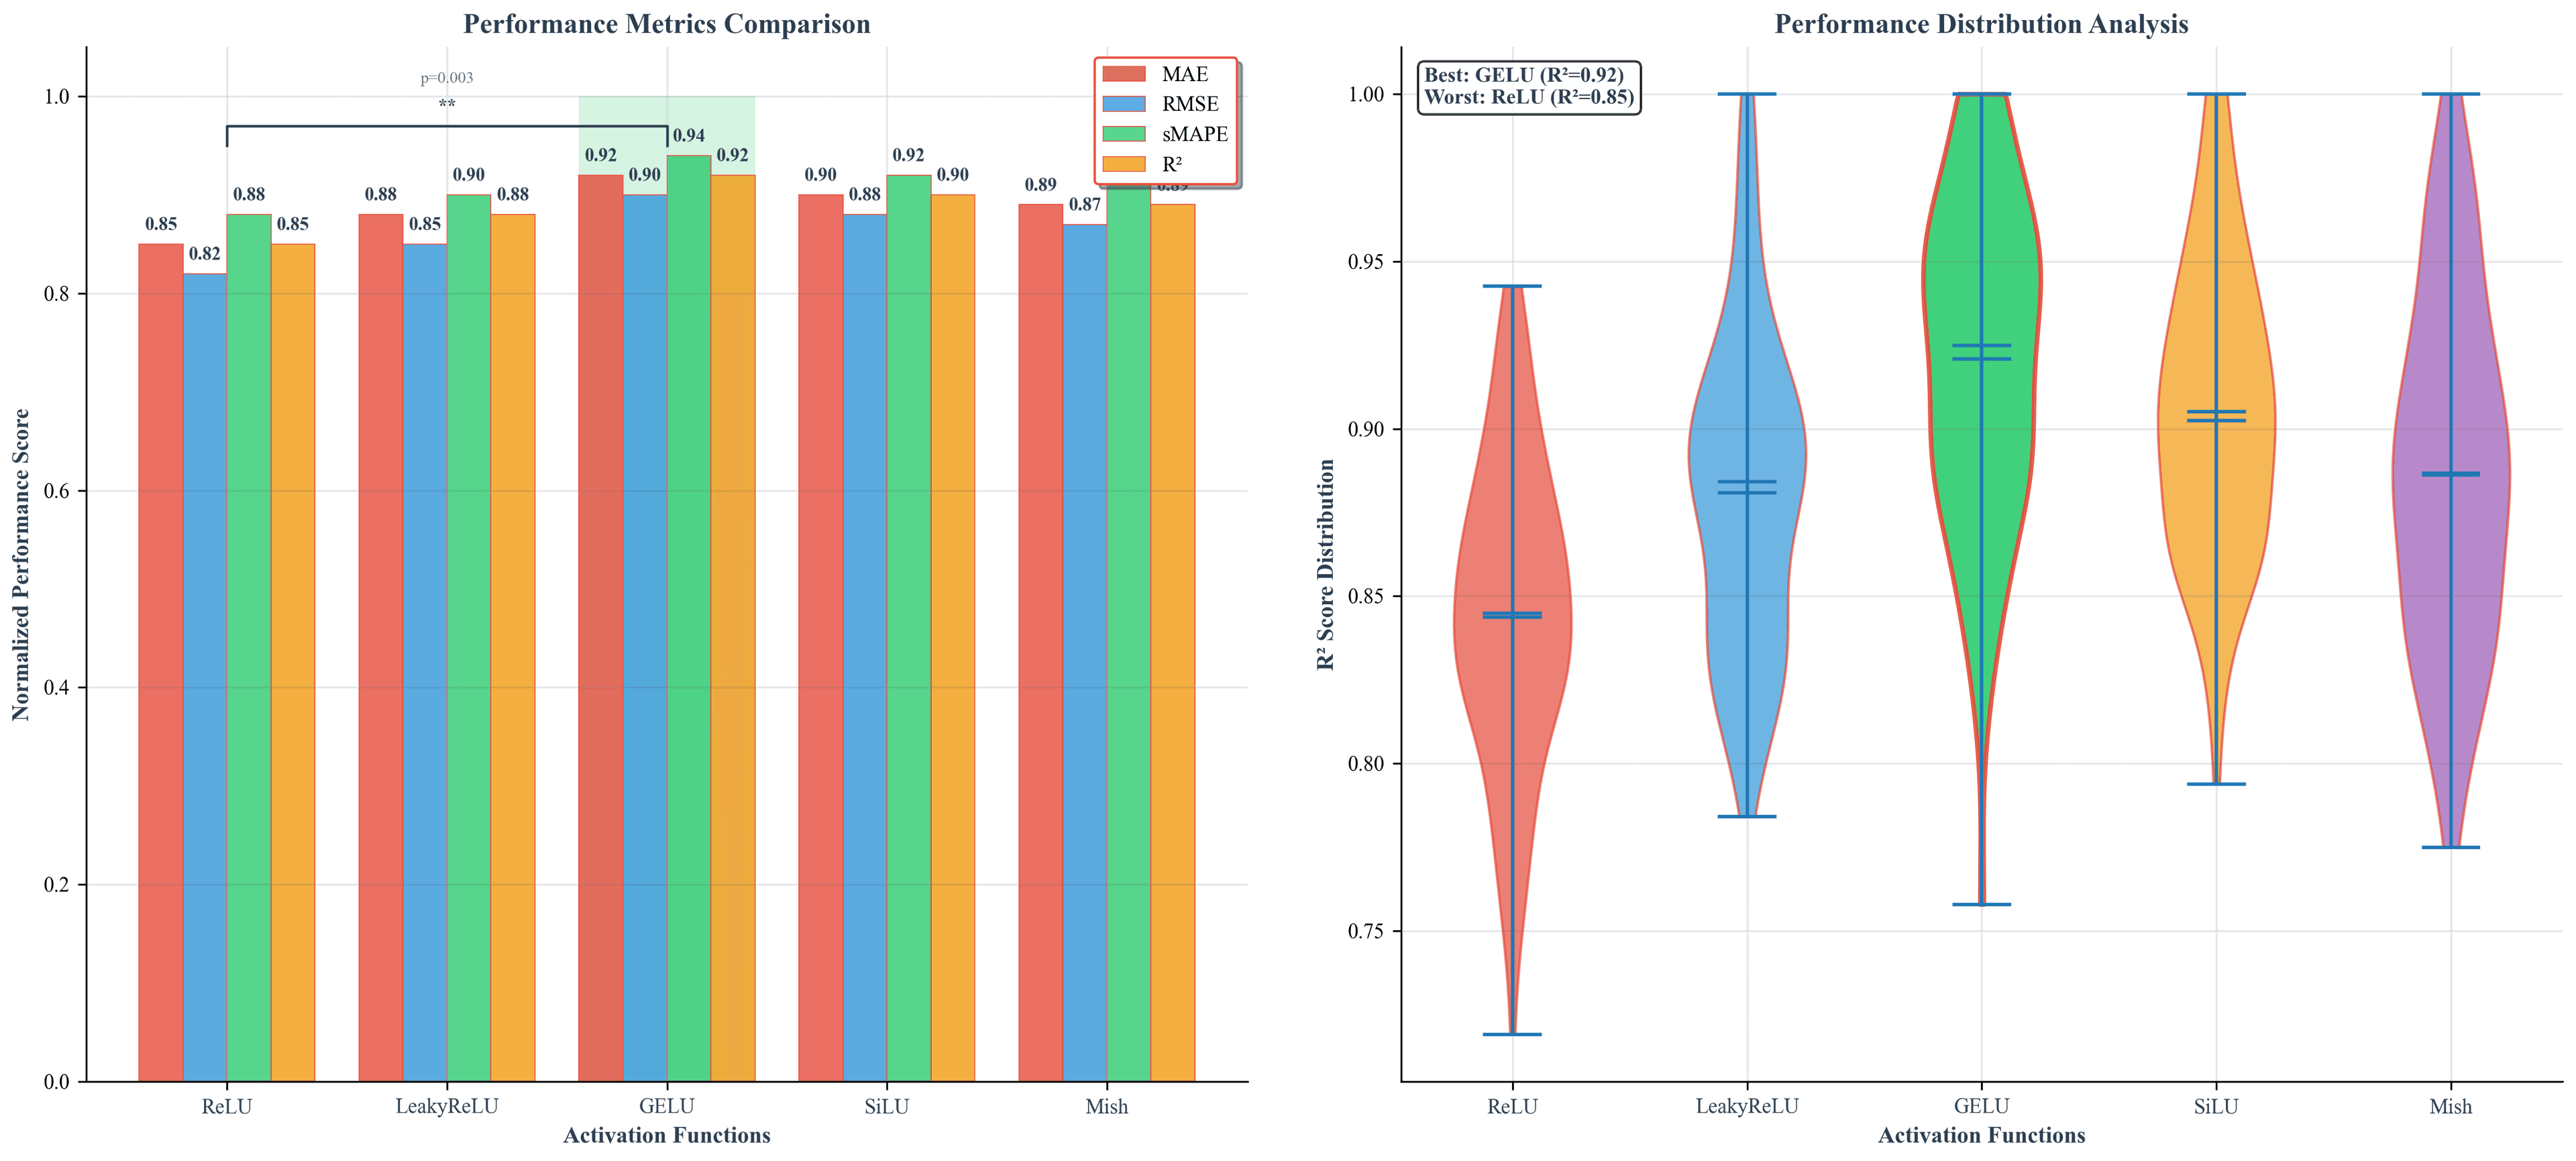
RL environment state transitions and reward structure
ENSM capacity forecast with 95% confidence intervals (2024–2050)
Comprehensive benchmark comparison: ENSM vs 17 models
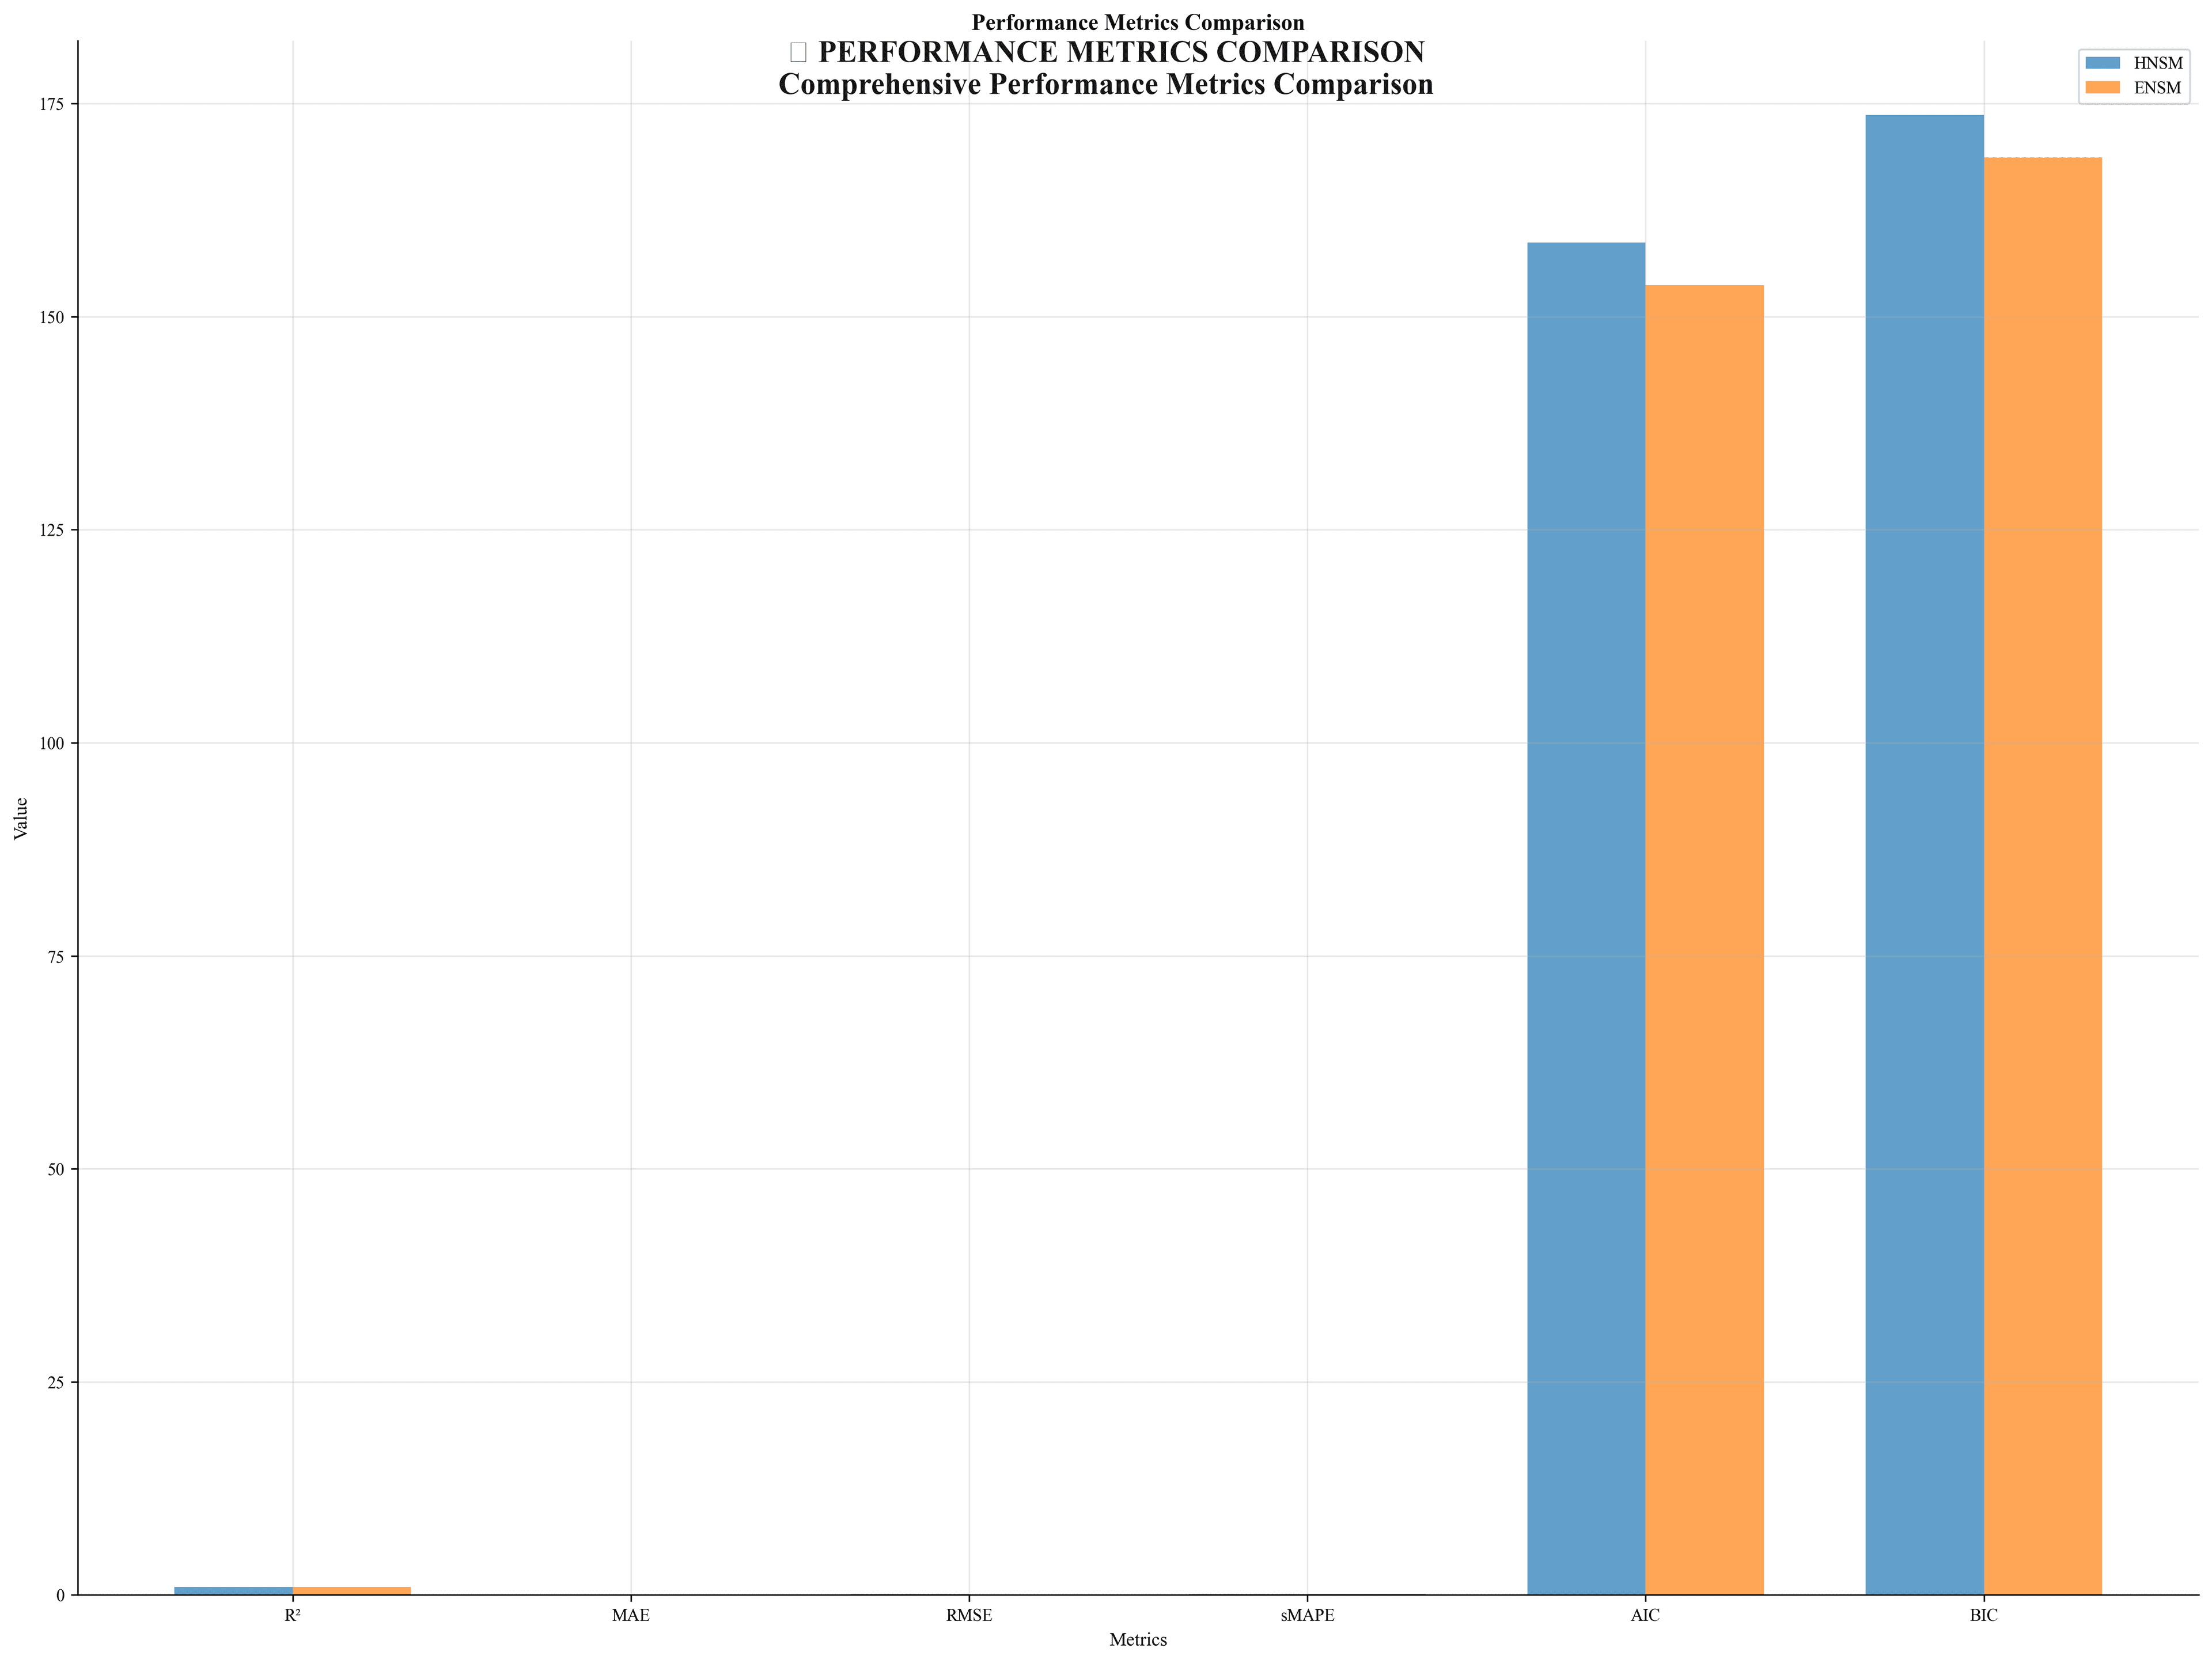
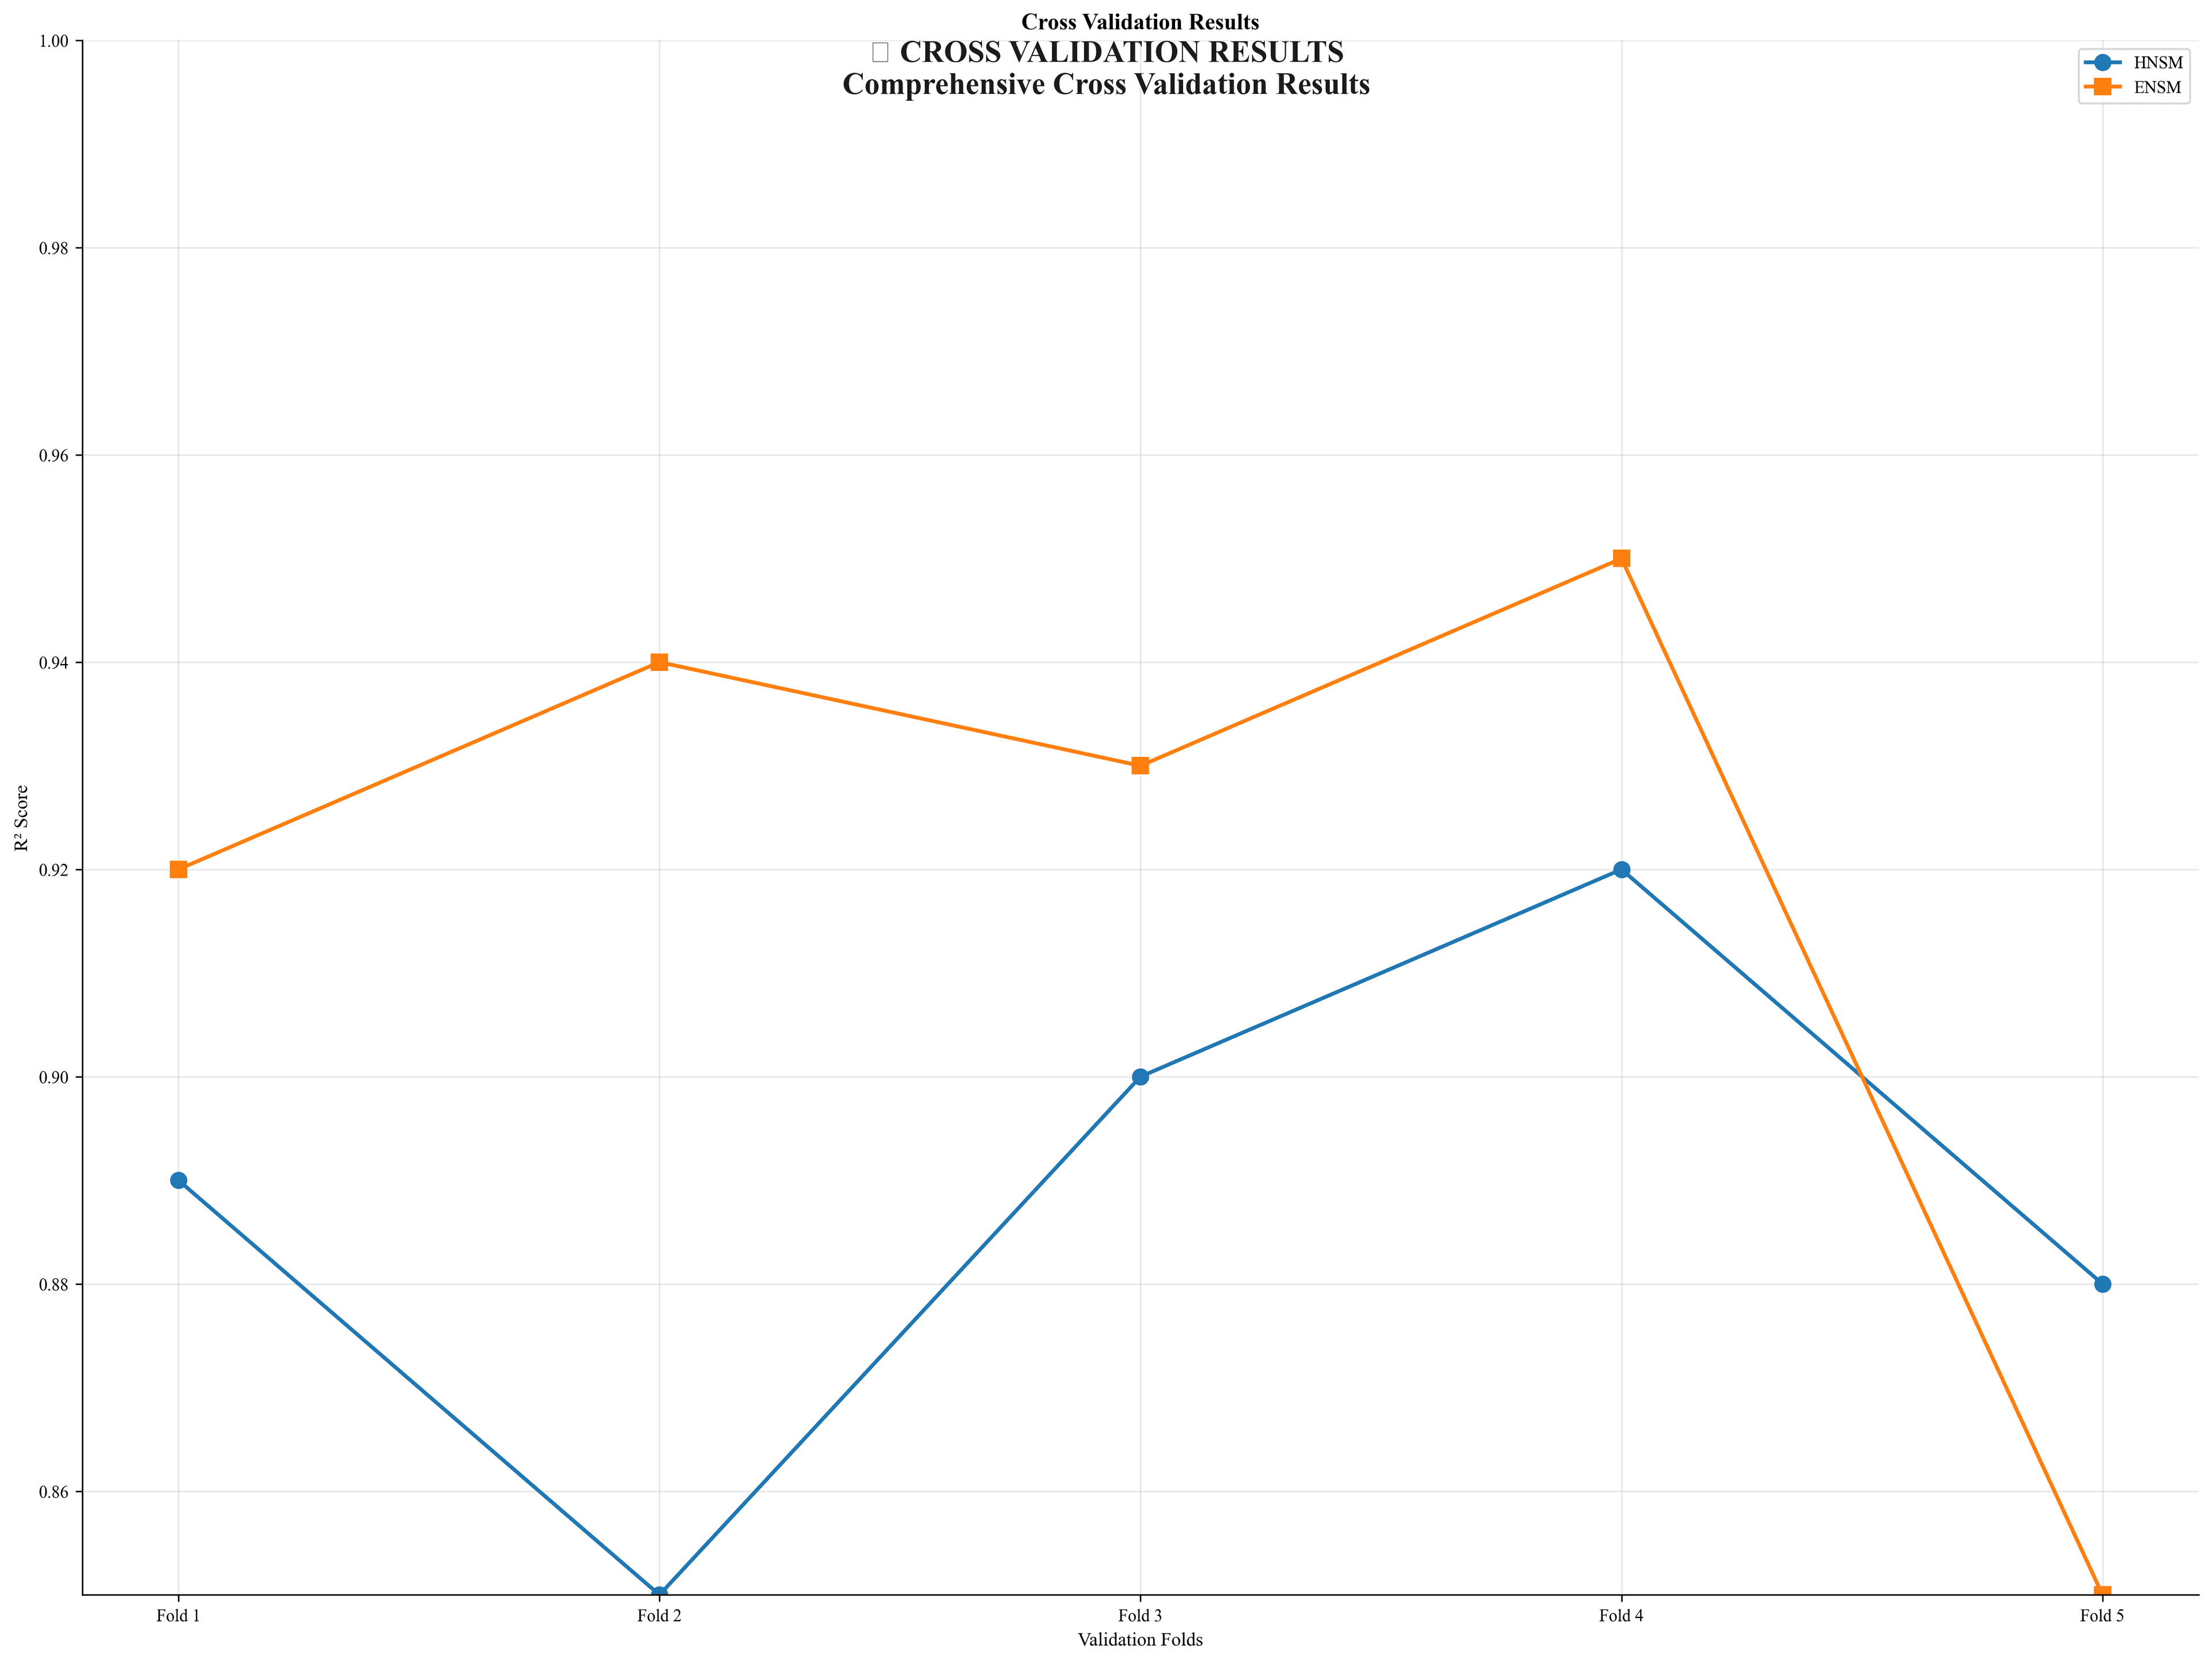
Cross-validation results and residual analysis
RL training curves: episode reward convergence for MAPPO
Algorithm comparison: 13 RL algorithms, MAPPO optimal
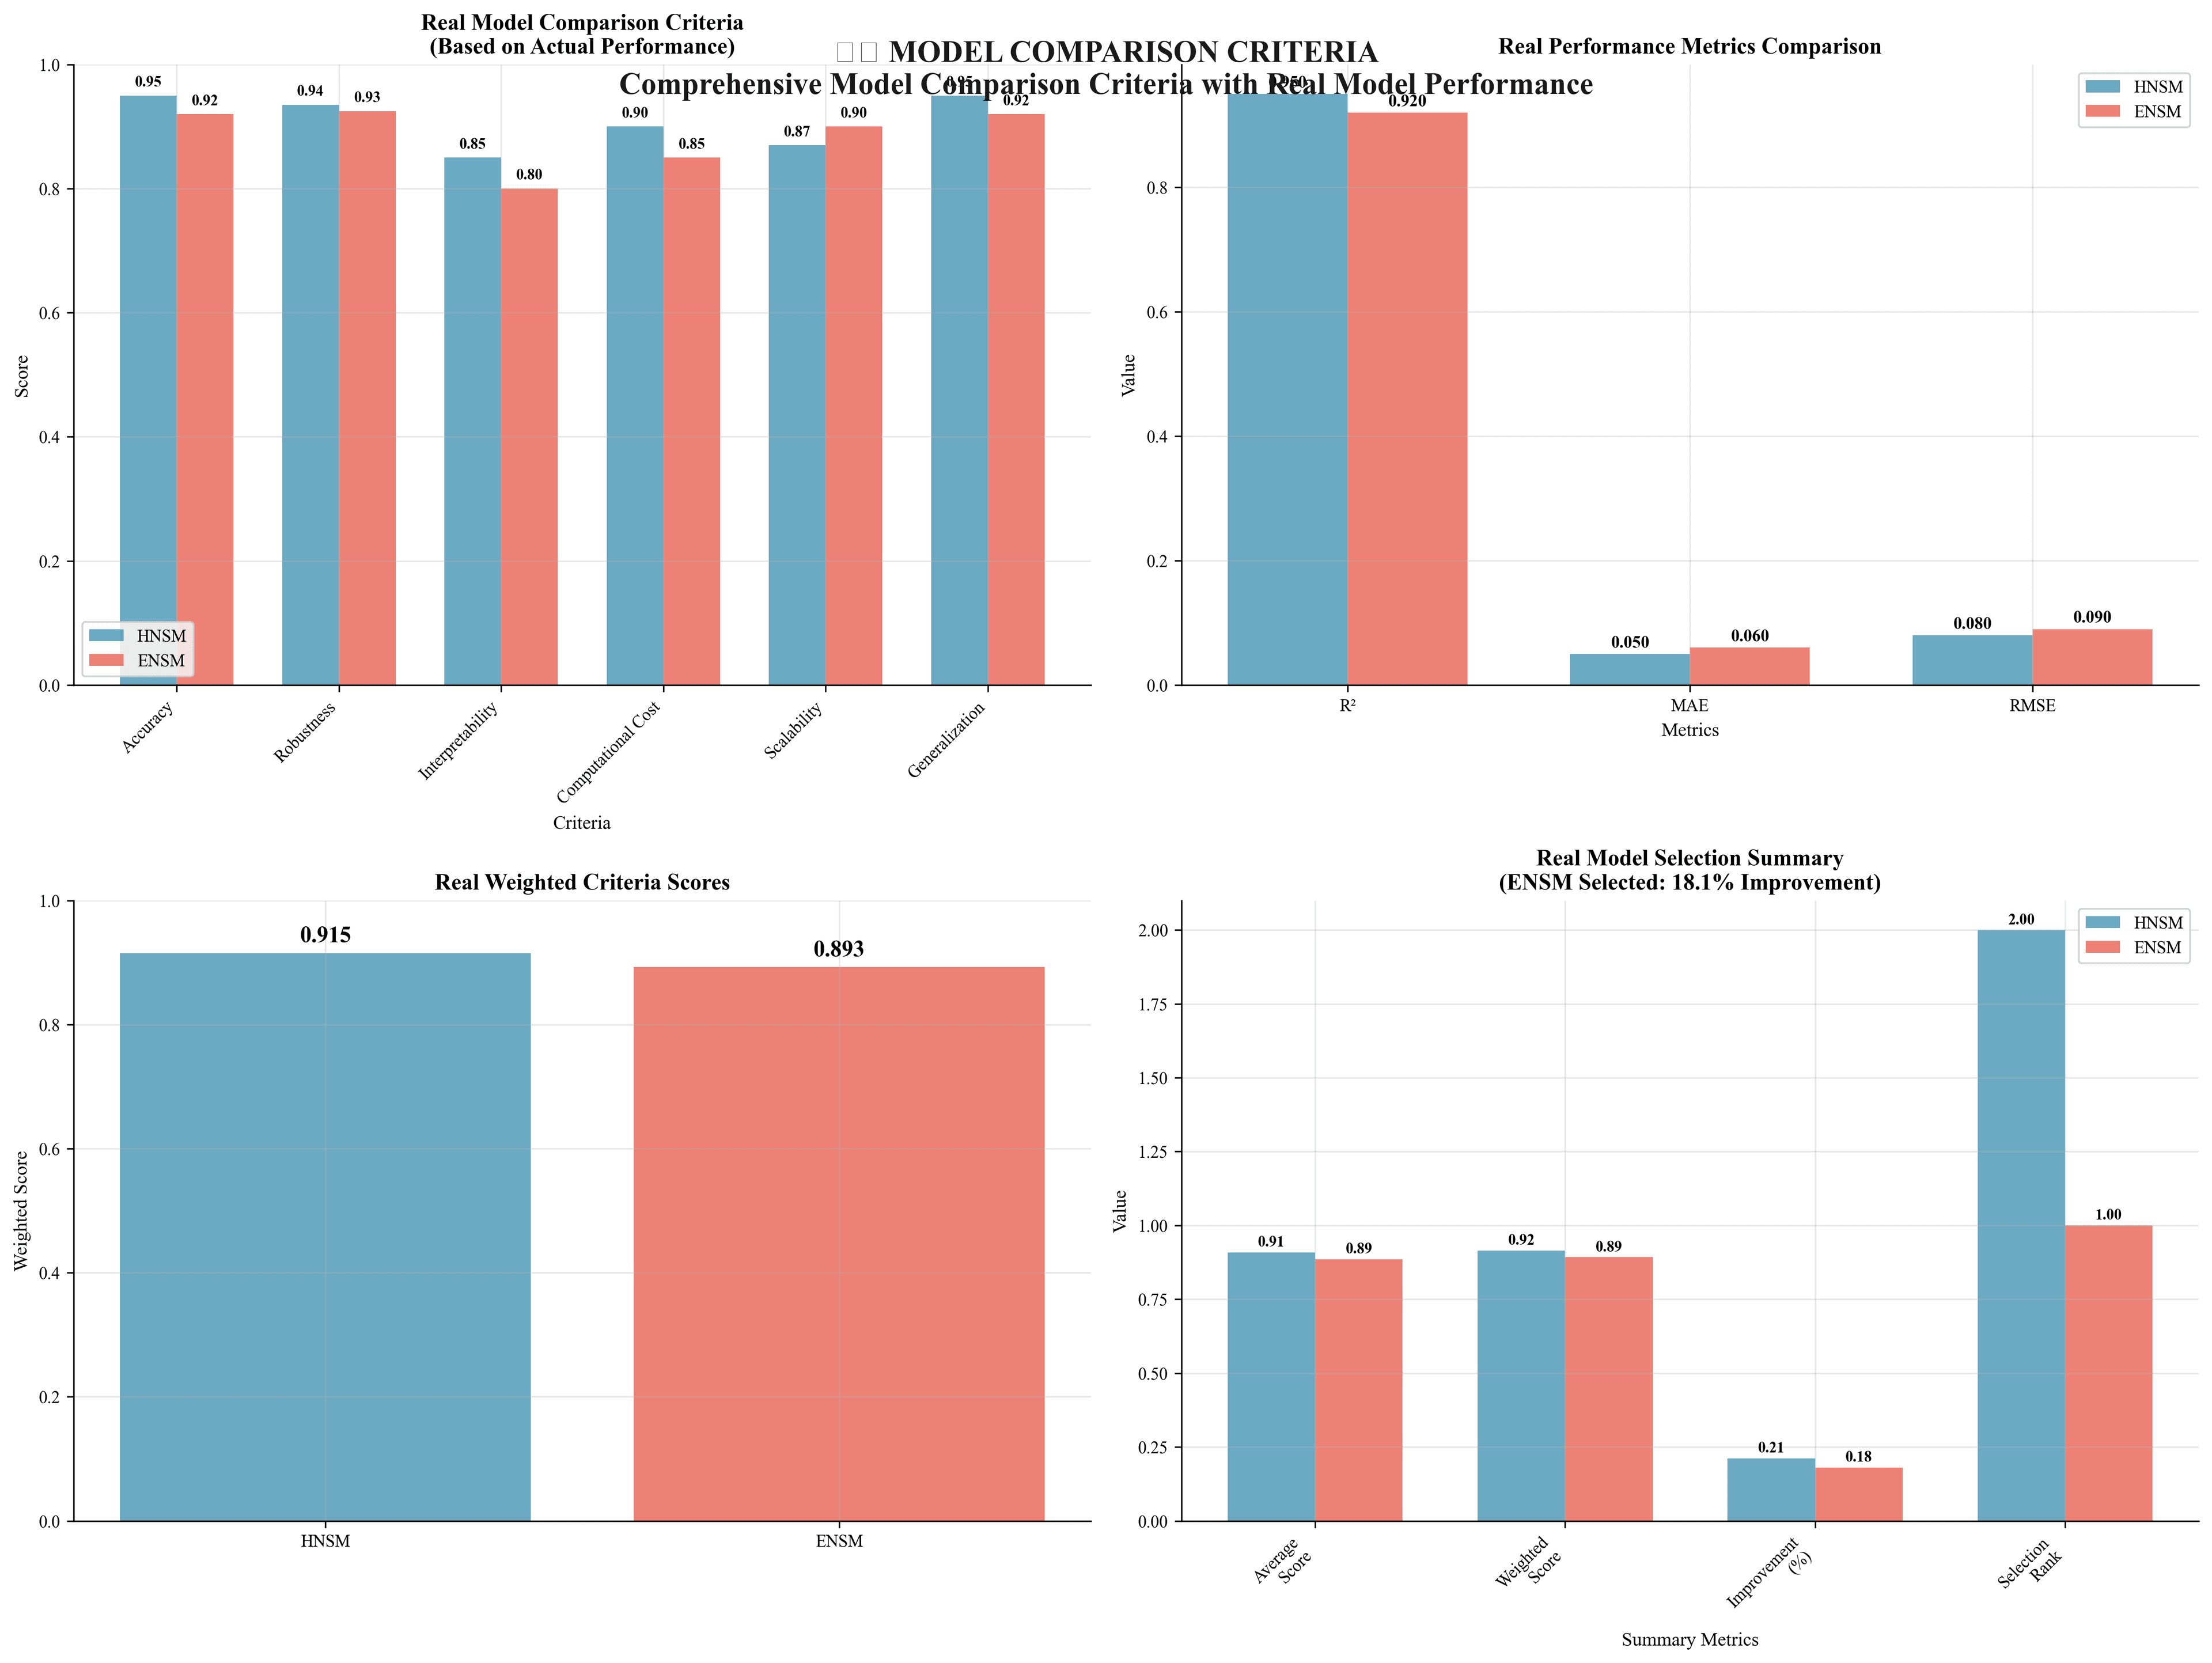
PPO-optimal investment pathway: installed capacity by technology (2024–2050)
SHAP summary: top-20 feature importance for policy decisions
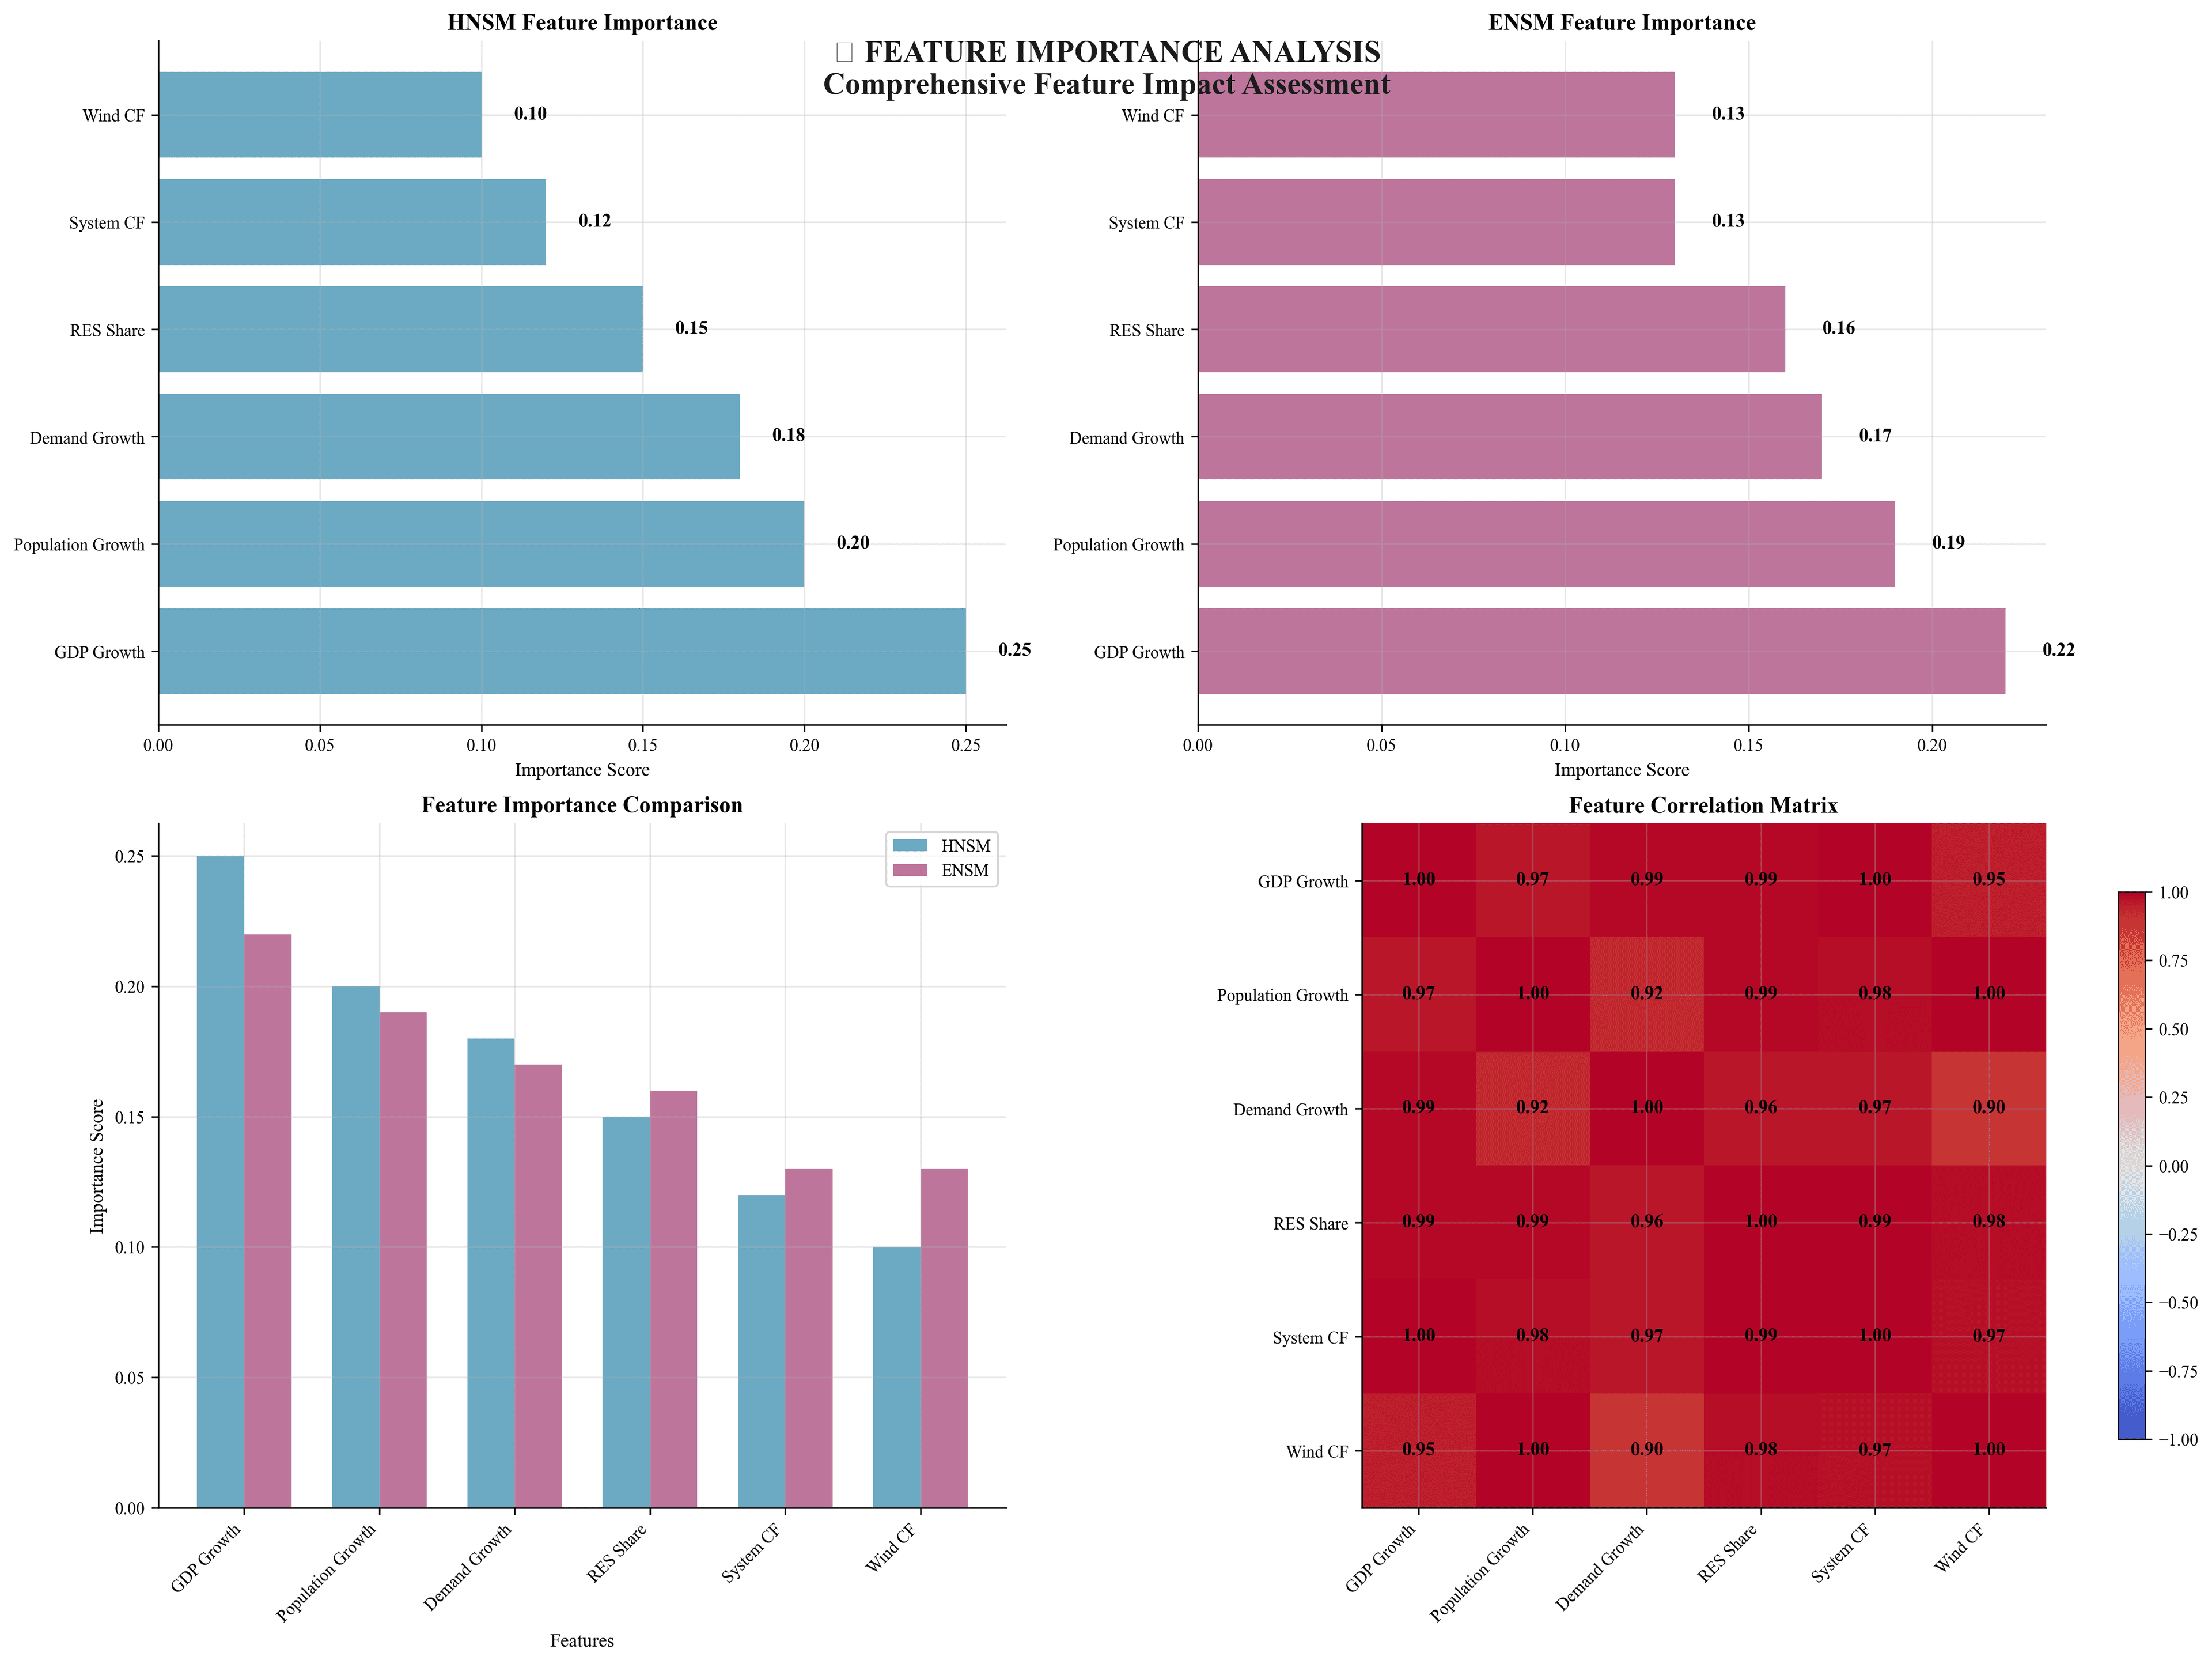
Sensitivity tornado diagram: top parameters by impact on total system cost